
Problem Number One on Weekend Homework.
Tree Population.
Original Problem.
Part 1. A tree has a population of 100. The tree to its right has population 200 and the tree to its left has population fifty. There is a uniform 10% transition rate between trees. Will this tree gain or loose population? How many bugs will it gain or loose? Sketch a trapezoidal approximation graph for these three trees and give the slopes and the rate of slope change for the middle tree. How could the rate of slope change have been used to predict the change in population.
Part 1.
Three trees are lined up with different bug populations as follows.
-1 0 1
50 100 200
The trees loose 10% to each adjacent tree. Therefore tree -1 keeps 90% of its population and loosed 10% to tree 0. So, tree -1 keeps 45 bugs and looses 5 bugs to tree 0. Tree 0 keeps 80% and looses 10% to both tree -1 and tree 1. So, tree 0 keeps 80 bugs and looses 10 bugs to both tree -1 and tree 1. Tree 1 keeps 90% and looses 10% to tree 0. So, tree 1 keeps 180 bugs and looses 20 bugs to tree 0.
Using this information you are able to conclude that the populations are as follows:
-1 0 1
55 105 190
Trapezoidal Graphs.
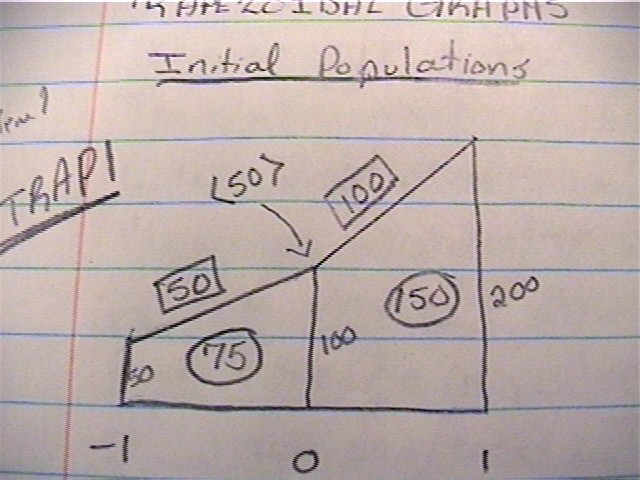
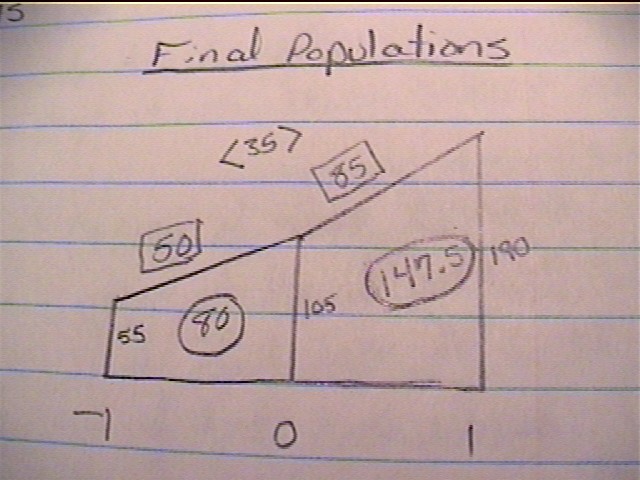
Initial Population. Final Population.


Using the information from the initial population graph you find that the change in slope is +50. With this in mind, you are able to conclude that the change in population for the middle tree will be positive. The reason for this is that if you have a positive change in slope then the trees neighboring the center tree will be giving more in total than the center tree is loosing.
Part 2.
Make up your own populations to cause a negative change in the center tree.
The trees still loose 10% to the adjacent trees. Therefore, one way to accomplish the task is to set up the populations as follows:
-1 0 1
50 200 50
Tree -1 looses 5 bugs to tree 0 and keeps 45 bugs. Tree 0 looses 20 bugs to both tree -1 and tree 1 and keeps 160 bugs. Tree 1 looses 5 bugs to tree 0 and keeps 45 bugs. Using this information you can conclude that the populations after the first transition are:
-1 0 1
65 170 65
Trapezoidal Graphs.
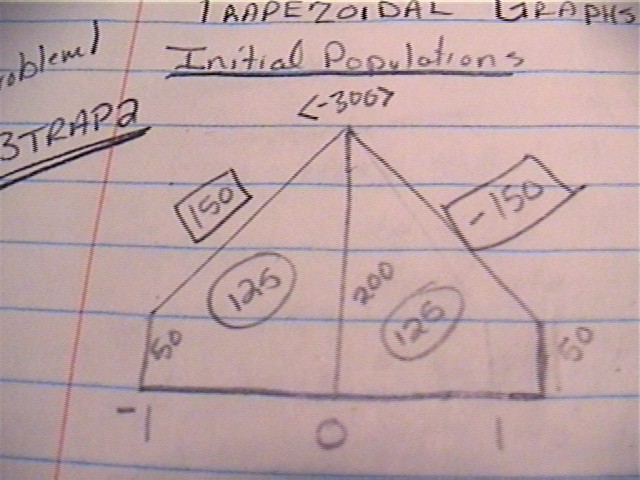
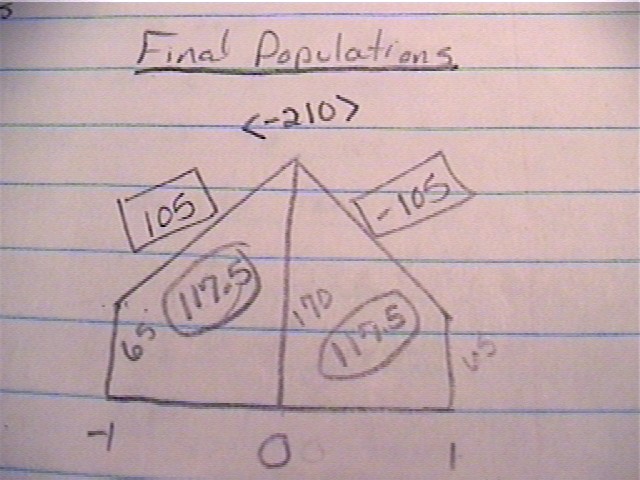
Initial Population. Final Population.


Due to the fact that the change in slope is negative you can conclude that the center tree is giving more than it is getting from its neighbors. Having this information you find that it will have a drop in population.
Part 3.
Meaning of slope change.
Slope change tells whether the population will increase or decrease. It does this because it is the difference from the first to the second slope. The slopes are the differences in the populations. When slope change is negative it means that the average population of the adjacent trees is less that the center, therefore they lose more, due to proportions, and the population decreases. If slope change is positive, then the trees adjacent to the center tree are loosing less and gaining more in proportion to the center tree. So, the center tree looses more and the population on it decreases over time until the populations level out.
Ryan Boone