 The
graph should look somewhat like this.
The
graph should look somewhat like this.Trapezoidal Graphs
Trapezoidal graphs use numbers
found when using a quadratic equation (y=a t^2 + b t + c) or the rate function
for that equation (y=2at + b). It
is first necessary to solve the equation for the variable y and get the numbers
that you will use in this graph. You
can use all the solutions to these equations and chart them on a graph.
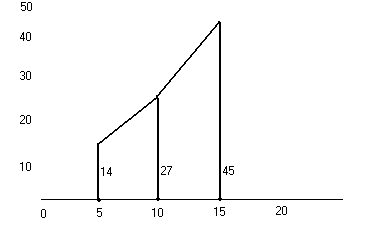
For example, lets say that you obtain the numbers 14, 27, 45 for the times, or
t, equaling 5, 10, and 15, by using one of the above equations. We want to
make a graph for Y vs. T. So we plot Y on the Y-axis. Then plot t on
the X-axis.  The
graph should look somewhat like this.
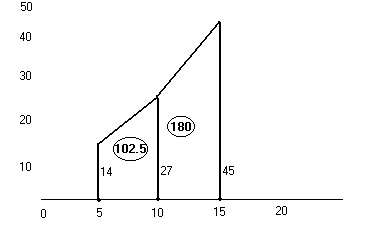
After a trapezoidal graph is constructed, you can find much more information using it. One thing is the area of between two points. To find this you add the height of both sides together and divide by two. This will give us the average height of the trapezoid. Next multiply by the interval between both heights (ex: 5 to 10 the difference is 5). This will give us the height. We can place our results for area in a circle in the middle of the trapezoid. The graph will look something like the below example.

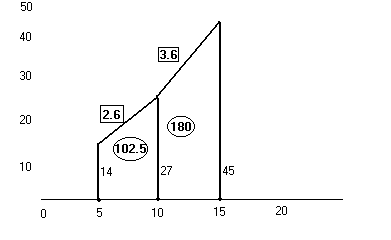
Another useful thing you can do with trapezoid graphs is tell the slope. Slope=Change in Y/Change in X. The slope has been entered in squares in the below example.

By creating a trapezoidal graph, as you can see, we can add a visual aid to finding certain things, such as area and slope. This can be extremely helpful in understand problems.